May 18, 2014
Convenience store KPI’s with drilldowns save time. A good graph is worth hours of analysis and a focused drill-down saves hours more. Graphs and drilldowns are favorite tools of analysts. Quickly assessing key performance trends and then being able to see the data that makes the trend is a great tool for maintaining accountability towards a goal.
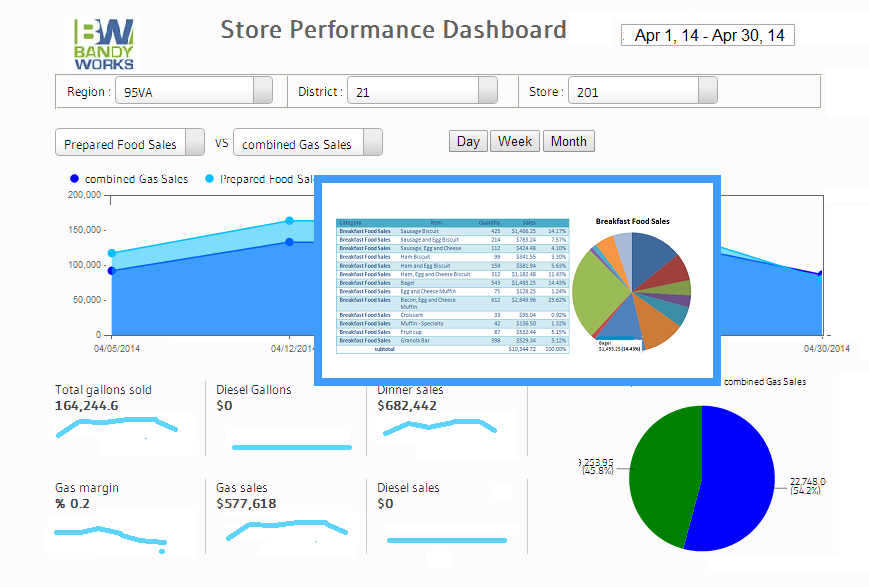
The ability to see a positive or negative trend quickly and then drill down to specific details gives an experienced manager a tool to assess performance and objectively ask questions that improve performance. One way to spot these trends is to group sales into categories that have specific meaning. The C-Store Performance Dashboard uses categories like fuel sales, prepared food and packaged items to summarize results. For example, the dashboard allows comparison of outside sales to inside sales.
Most C-Stores already have the basic information in electronic form. It is a straight forward process to extract and transform data from the mainstream C-Store systems such as ADD Systems, PDI/Enterprise, DataMax Envoy, Factor Store Trak or most other commercials systems. Adding an analysis component is the natural progression of an operations-focused IT system. The addition of business analytics provides maximum value from operational systems already in place.
By grouping data and providing filters for these sales categories, different combinations compared. A simple drop menu allows the non-technical user an intuitive mechanism for checking for relationships and monitoring trends. Such data analytic techniques explain how convenience store KPI’s with drilldowns save time.
KPI’s Show Trends
Once a significant trend or interesting relationship is discovered, a drilldown on those trends allows detailed information that is tied directly to the point of interest to be delivered quickly and sorted according to significance. In the example below, the details for breakfast sales for the week selected are presented and delivered as a percentage of the breakfast category.
Starting with a robust template, a C-Store can quickly organize their data for performance tracking and accountability. It is valuable to be able to spot trends and gather the details to understand exactly how performance changes are occurring.
Ask for a test or a limited trial of any c-store data analytics tool. A strong vendor should understand C-Store performance and be able to find issue or explain great results. Either way you win!
Related topics
Creating dashboards that work for you
Convenience Store Performance Analytics like Google Dashboard